
I'm a paragraph. Click here to add your own text and edit me. It's easy.


REGIONAL ECONOMIC DATA
Greater Newport Demographics
The Region's Workforce
The Greater Newport region has seen similar employment growth as the State overall. From January 2020 to December 2023, the Greater Newport region has added 3,306 jobs (66,950 to 70,256) for 4.9% growth. By comparison, the state saw 5% job growth during the same period. However, the region experienced higher wage growth compared to the state at 18% growth from 2019 to 2023 compared to 17% for the state.
Growing Industries in the Region, 2013-2023
10 industries in the Greater Newport Region experienced growth from 2013 to 2023, with those jobs in the Professional, Scientific, and Technical Services demonstrating the greatest growth by both number and percentage (an addition of 2,083 jobs and 64% growth).
Growth in this sector is driven by the presence of Naval Station Newport and the contractors that serve its operations, as well as the desirability of the region for more senior professionals.

Source: U.S.Census Bureau, Center for Economic Studies, LEHD - Quarterly Workforce Indicators.
Of 10 industries in the Greater Newport region that saw growth over the last decade, 6 of these also experienced growth that outpaced the sectors’ respective US averages.
The surge in Professional Scientific and Technical job growth is impressive and a turnaround from the 2008-2018 period documented as part of the 10-Year Economic Development Strategy published in 2021. During that period, the sector had added 467 jobs for 13% growth.
With the increased investment occurring at Naval Station Newport and a growing portfolio of Blue Economy businesses in the region, this sector is expected to see continued growth.

Source: U.S.Census Bureau, Center for Economic Studies, LEHD - Quarterly Workforce Indicators

Educated Workforce
The region’s residents possess academic credentials at rates above RI and National averages with 55% and 54% with a Bachelor’s or Higher degree in Bristol and Newport County, respectively. This compares to RI (39% and the US average of 37%.
This base of an educated workforce makes the greater Newport region a desirable location for businesses.
More Commuters
There are 18,537 people who live outside of Newport County but commute there for work, which is known as workforce outflow.
Meanwhile, 19,413 people live in the county but commute outside of it - the workforce outflow. 17,104 residents live and work in the county, a share that has decreased 4.4 percentage points from 2012 and 20.3 percentage points from 2002. Since 2012, net job inflow and outflow have decreased from -1,914 in 2012 to –876 in 2022.

Source: Census OnTheMap, 2022
Greater Newport Benchmarking
Regional Benchmarking: Comparison and Trends in Key Areas
As part of the 10-Year Economic Development Strategy nine regions that possess similar characteristics to Greater Newport were identified. These other metropolitan areas offered similar characteristics as Greater Newport; these include locations that are popular tourist destinations, have a robust military presence, are located on the East Coast, and are relatively close to a major city. Of the nine similar benchmark regions,
Greater Newport remains the most educated and has the second-highest median household income.
In reviewing the data since this information was first published in 2021, utilizing the most recent data, which was from 2019, the following tables highlight where there have been more significant changes. Population in the Greater Newport region has grown by approximately 4%, which has outpaced or is on par with the other regions except Myrtle Beach, which has seen significant growth. The Connect Greater Newport Housing study has noted that Older adults and retirees are driving population growth.
The region's population grew among adults aged 55 years and older. However, the region lost population for residents aged 30 to 54 years and residents under 30 years old.


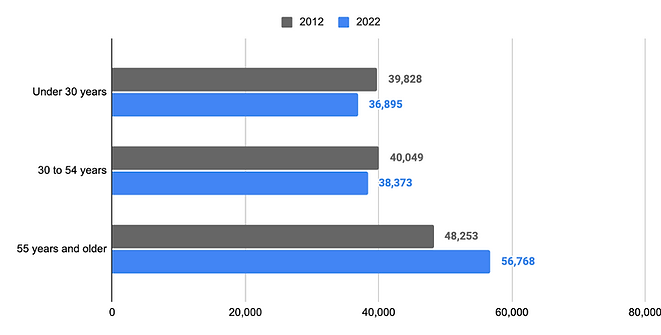
Source: U.S. Census Bureau ACS 5-Year Estimates, 2019-2023 - Census Business Builder
The following two charts illustrate that there has been significant growth in median household income as well as median housing values. While the growth in median household income can be seen as a positive trend and the Greater Newport region is outpacing its peers, the data do not represent a change in continuous households rather, they most likely represent the influx of additional higher wage earners that are replacing others who are not able to afford to live in the region. The Connect Greater Newport Housing Analysis has more details on this dynamic.
A positive note is the increase in median housing value as compared to the peer communities. Greater Newport is on the lower end of increases. It will be important to see how these rates of increase impact workers and new residents in the region and if there becomes an equilibrium between income and housing value increases.


Small Business Profile
The Newport region has seen 6.5% growth in small businesses from 2012 to 2022, a definition that includes establishments in Newport and Bristol counties with fewer than 500 employees.
As part of its mission to serve the region’s business community, the Greater Newport Chamber of Commerce and its regional economic development initiative - Connect Greater Newport, visit with businesses and conduct surveys to understand their needs and opportunities.

Business Perspectives
In late 2024 a business survey was conducted with 122 responses (84% were profit businesses).
-
Revenue and Demand: Many businesses have experienced increased revenue and demand compared to the previous year.
-
Cost Pressures: Businesses are facing increased costs for goods and services, leading to price increases.
-
Top Challenges: The top challenges facing businesses include recruiting and retaining workers, the cost of offering employer-sponsored health insurance, and access to financing and capital.

Source: U.S. Census Bureau - Center for Economic Studies - Business Dynamics Statistics (2022)
Rating Current Business Performance
54% of respondents would describe their business’s current performance as “Excellent” or “Above Average,”. By comparison, 32% of businesses statewide rated their current performance as “Excellent” or “Above Average,” and only 29% of businesses nationally rated their current performance as such.
Looking ahead 6-months:
58% believe that six months from now, they will describe their business’s performance as “Excellent” or “Above Average.”
By comparison, 33.2% of businesses statewide rated their current performance as “Excellent” or “Above Average,” and only 32.2% of businesses nationally rated their current performance as such.
These findings demonstrate confidence in the business community that should support investments and growth.

